What's Inside an iPhone Sysdiagnose Log (and What It Reveals About Your Hardware)
Short answer: an iPhone sysdiagnose is a compressed .tar.gz folder that iOS fills with system snapshots (processes, memory, disks), subsystem logs (battery, Wi-Fi, app installs, power), crash reports and a copy of the unified system log. For hardware, the useful parts are a handful of text files: the two I/O registry dumps in ioreg/ hold the serials of the display panel, battery and camera modules plus the RAM and storage details, and the battery folders under logs/ hold health and cycle data. Everything else is mostly about software and activity.
Apple describes sysdiagnose as a way to collect logs for bug reports and gives the capture steps on its Profiles and Logs page. If you don't have a file yet, start with How to get a sysdiagnose file on iPhone.
How the archive is laid out
When you save the file from Settings → Privacy & Security → Analytics & Improvements → Analytics Data, you get one archive named like sysdiagnose_2026.10.23_10-15-33+0800_iPhone-OS_iPhone_<build>.tar.gz. Unpacked, it is a single folder with plain-text command outputs at the top level and subfolders for each subsystem.
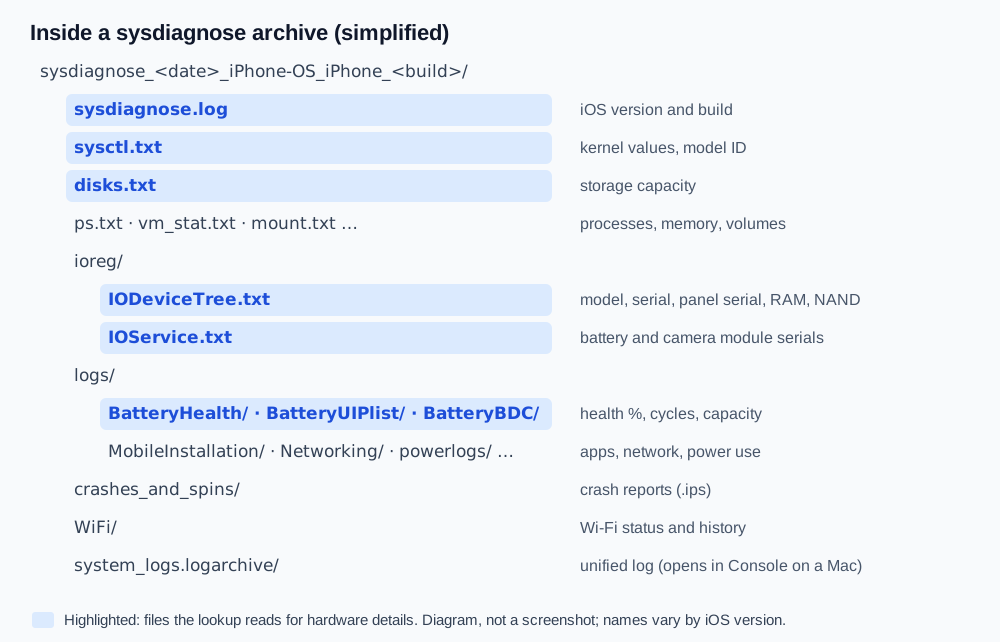
Exact contents change between iOS versions. A digital-forensics review of iOS 16 sysdiagnose, for example, found new logs/ subfolders such as BatteryHealth, BatteryUIPlist and BatteryBDC that weren't in earlier versions, while a few older folders had disappeared. So treat any file list, including the one below, as typical rather than guaranteed.
The files that describe your hardware
Most guides about sysdiagnose logs are written for security researchers and focus on app activity. If you want to know what's in your phone, these are the files that matter. The table lists the files our lookup tool actually reads and the report fields it fills from them:
| File in the archive | What's in it | Report fields it feeds |
|---|---|---|
ioreg/IODeviceTree.txt |
Device tree: model identifier, device serial, display panel serial (raw-panel-serial-number), RAM vendor/size/type (dram-vendor, dram-size, dram-type), storage vendor |
Model, Serial (masked), Display serial, Memory vendor, Memory capacity, Memory type, Storage vendor |
ioreg/IOService.txt |
Live hardware services: battery serial and counters, camera module serials (BackCameraModuleSerialNumString, FrontCameraModuleSerialNumString, and telephoto / ultra-wide equivalents), storage model and cell type |
Battery serial, Cycle count, Rear / Front / Telephoto / Ultra-wide camera serial, Storage model, Storage type |
logs/BatteryHealth/BatteryHealth.log |
Battery health history | Battery health, Cycle count |
logs/BatteryUIPlist/… |
The data behind the Battery Health screen | Battery health details (design capacity, max capacity, temperature) |
logs/BatteryBDC/*.csv |
Battery data collection tables | Backup source for capacity values |
sysdiagnose.log |
The capture's own log, including the OS version and build | iOS build |
sysctl.txt |
Kernel settings and identifiers | Model fallback, build fallback |
disks.txt |
Mounted volumes and their sizes | Storage capacity |
The serials are the key. A display panel serial, battery serial or camera module serial starts with a code that identifies the supplier, so the tool decodes the maker from that prefix: Samsung, LG or BOE for screens (see which models use which), Desay, Sunwoda, Simplo or ATL for batteries (battery makers explained), and LG Innotek and others for cameras (camera suppliers). If a prefix isn't on the known list, the report says Unknown instead of guessing.
The baseband (modem) chip ID is also searched for across the extracted text, which is how the report fills Baseband vendor.
What the rest of the logs are for
The remaining files are useful for troubleshooting, not for identifying parts:
| Area | Typical files | What it tells you |
|---|---|---|
| Processes and memory | ps.txt, ps_thread.txt, vm_stat.txt, taskinfo.txt |
What was running at capture time and how memory was used |
| Crashes | crashes_and_spins/*.ips |
App and system crash reports |
| Unified log | system_logs.logarchive |
Recent system messages from every subsystem |
| Power | logs/powerlogs/ |
Battery drain and power use by component and app |
| Network | WiFi/, logs/Networking/ |
Wi-Fi status, scans and connection history |
| Apps and setup | logs/MobileInstallation/, logs/MobileActivation/ |
App installs and updates, activation events |
None of these name a component maker, and they don't record repairs. For repair status, iOS uses Settings → General → About → Parts and Service History instead (what those labels mean).
How to open it yourself
- Move the file to a computer. AirDrop or Files is easiest; archives are often hundreds of megabytes.
- Unpack it. On a Mac, double-click the
.tar.gz. On Windows, use a tool that handles tar archives, such as 7-Zip (you may need to extract twice:.gz, then.tar). - Search the text files. Open
ioreg/IODeviceTree.txtin any text editor and search forraw-panel-serial-numberordram-vendor. Openioreg/IOService.txtand search forCameraModuleSerialNumString. These files can run to several megabytes, so use search rather than scrolling. - Open the unified log on a Mac.
system_logs.logarchiveopens in the Console app.
Reading the raw values is the easy part. Turning a panel serial like G9N… into "Samsung" needs a prefix table, and battery capacity values may be stored in different keys depending on the iOS version. That decoding is what the lookup does for you.
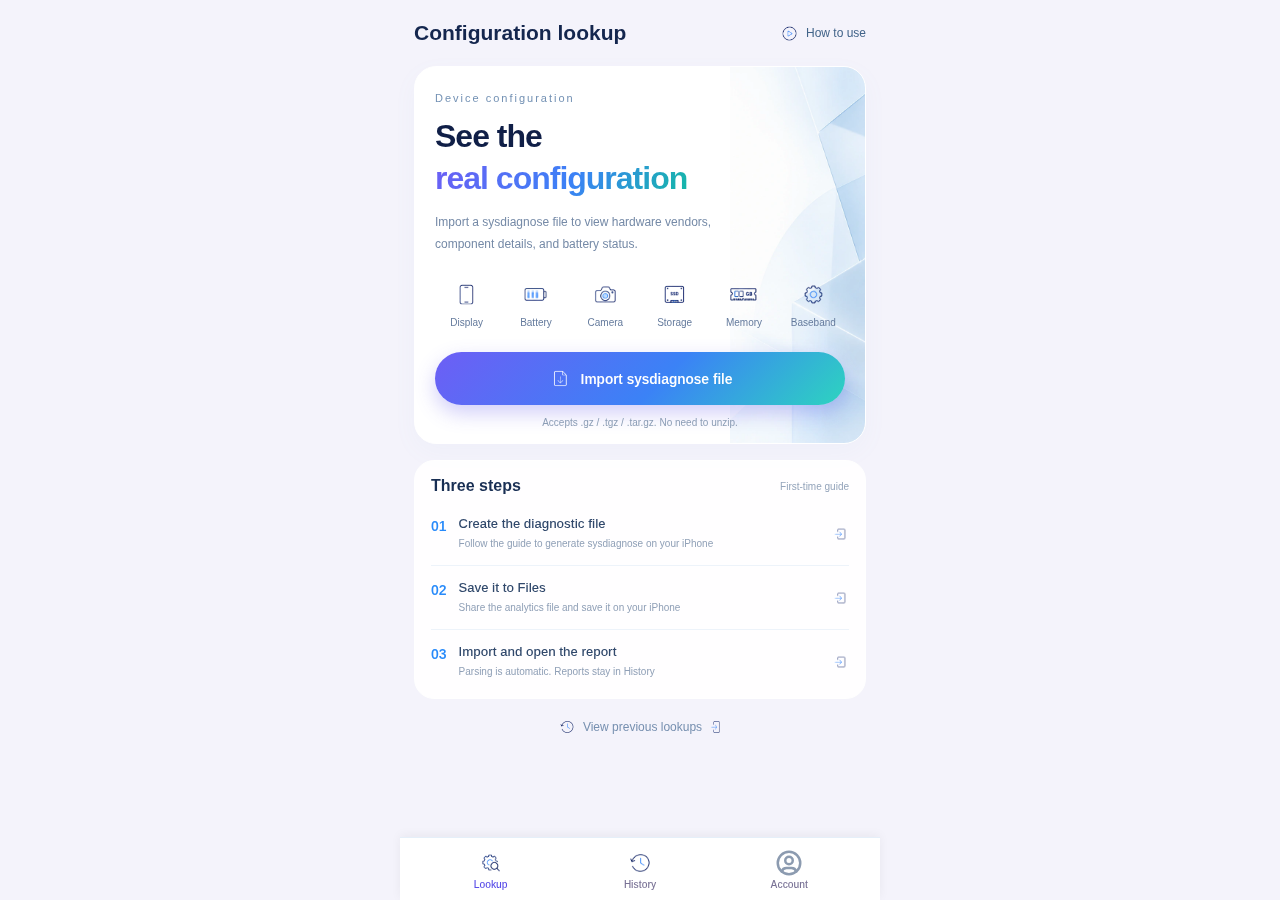
Skip the manual digging: open /lookup/ in Safari on the same iPhone and import the sysdiagnose_ file from Files. You get the display, battery, camera, memory, storage and baseband makers in one report.
Privacy: what you're sharing
A sysdiagnose contains no photos or messages, but it does include identifiers (such as the device serial), the list of installed apps, network names and detailed activity logs. Share the full archive only with people or tools you trust. In our report, the device serial is shown masked (first four and last four characters), and the lookup's terms state that its import flow does not upload the original diagnostic file. When you're done, delete the copy you saved to Files.
FAQ
Can I read sysdiagnose logs on the iPhone itself?
Only partly. In Analytics Data you can tap a file to view text, but the sysdiagnose is a compressed archive, so its contents aren't readable there. Use a computer or import it into the lookup tool.
Do sysdiagnose logs show if a part was replaced?
Not directly. They show the serial and maker of the part that's installed now. Compare that with Parts and Service History, or with what the original supplier for your model should be. See how to check if iPhone parts are original.
Why is my sysdiagnose missing the battery folders?
Folder names vary by iOS version, and some captures are incomplete if the phone restarted or ran out of space. Update iOS, capture again, and wait the full 10 minutes.
Does the display info include the screen maker by name?
No. The I/O registry stores the panel serial, not a company name. The maker is decoded from the serial's prefix; details in How to check who made your iPhone screen.
Is a sysdiagnose the same as an analytics or crash log?
No. Analytics Data also lists single-event files (crash logs, .ips reports). A sysdiagnose is the big archive that bundles many of those together with system snapshots.
Import a sysdiagnose file to see the display, battery, camera, storage, memory and baseband makers in one report. Lookups use a paid quota.
Open the lookup tool